
Tag Archives: education

How to spot False Breakouts
23 DecBreakout trading has become popular as traders await many pairs to breakout from their consolidating ranges. Trading a breakout strategy is fairly straight forward; traders will look to buy a breakout of price above resistance or sell as price breaks through support. However, there is one question on the back of everyone’s mind. How can I avoid false breakouts?
A false breakout occurs when prices moves through a support or resistance level and proceeds to immediately move in the opposing direction.As a trader, you must be familiar with how to identify a false breakout over a legitimate break out. Many traders try and force trend entries when a breakout occurs even though the market has no intention of honoring that breakout.

Share this:

Low volatility trading
22 Dec Even the most well trained trader with the best Forex trading system will not be able to gain significant profits if the market is flat. In this article, we will discuss how to trade when the markets are traded in low range. The main problem with a flat market is that currencies are traded in a narrow range and it is much harder to reach the TP target. During trading sessions with low ranges, traders tend to trade in larger amounts than they normally would. This causes overtrading and causes the trader to lose control.
Share this:

Order types in forex market.
6 Dec While most trading software is straightforward with order entries and the opening or closing of a position, the beginner may be bit confused by terms like stop-loss, trailing stop, or take profit orders, at least a basic understanding of which is crucial for a properly managed account. Continue reading
Share this:

Basic Patterns
20 Oct
The ascending triangle pattern resembles a narrowing triangle with a horizontal line of overhead resistance for the stock and an ascending trend line or rising trend line beneath the stock. The overhead resistance temporarily prevents the stock from advancing higher, while the rising trend line beneath the stock signals that buyers are still present. An upside penetration of the upper horizontal trend line is a technical buy signal for a stock breaking out from an ascending triangle pattern.

A bearish signal, the pattern is normally observed as a continuation pattern in a down-trend but can be a powerful reversal signal when encountered in an up-trend.

This pattern shows two converging trendlines (support levels & resistance levels) and is (1) a bearish formation that usually forms during a currency pair downtrend as a continuation pattern (downtrend will continue) or (2) a bullish formation that usually forms during a currency pair uptrend as a continuation pattern. (uptrend will continue).

The rectangle pattern is one of the most common used technical analysis patterns. The rectangle pattern is formed when you have two specific levels where the market bounces from. In other words, the sellers are in control at the top of the pattern, while the buyers are in control at the bottom. The resulting back and forth action produces a rectangle-shaped pattern that is instantly recognizable, especially on higher time frames. After the break-out price will move at least the high of the rectangle shape (upwards or downwards depending on traders).

Bull flags are continuation chart patterns found within an up trending market. They are formed after a steep price advance by two tight parallel down sloping trend lines in a near 35-45 degree angle. The pattern is confirmed on a upward breakout of the bull flag.
Bear flags are continuation chart patterns found within a downtrend. They are formed after a steep price decline by two tight parallel upward sloping trend lines in a near 35-45 degree angle. The pattern is confirmed on a downward breakout of the bear flag.
Bullish pennant just as with the Bull Flag the pennant portion of the pattern can be either pointed straight ahead or downward and the pole is formed by the move upward which sets up the pennant shaped consolidation.
Bearish pennant just as with the Bear Flag the pennant portion of the pattern can be either pointed straight ahead or upward, and the pole is formed by the move downward which sets up the pennant shaped consolidation.

Double bottom is formed at the bottom and indicates the end of a falling market. This pattern is identical to the double top, except for the inverse relationship in price. The pattern is formed by two bottoms separated by a top. The confirmation occurs when the price goes above the top or the confirmation line. Most rules associated with the double top formation are also applicable to double bottom pattern.

A rising wedge needs at least four ‘touches’ or tests of a trendline to confirm the pattern. Generally, upon the fourth touch (or test), we would want to be waiting to enter on a breakdown of the lower trendline and place a stop above the upper trendline. The wedge is a consolidation pattern, and as such, we would expect to see the volume trend decline (reduce) as either the Rising or Falling Wedge pattern develops, and then expand as price breaks outward from the pattern.
For a falling wedge the conditions to analyze the pattern are the same as rising wedge.
Head and Shoulders.

The Head and Shoulders Top is an extremely popular pattern among investors because it’s one of the most reliable of all formations. It also appears to be an easy one to spot. The first point – the left shoulder – occurs as the price of the financial instrument in a rising market hits a high and then falls back. The second point – the head – happens when prices rise to an even higher high and then fall back again. The third point – the right shoulder – occurs when prices rise again but don’t hit the high of the head. Prices then fall back again once they have hit the high of the right shoulder. The shoulders are definitely lower than the head and, in a classic formation, are often roughly equal to one another.
Inverted Head and Shoulders.

This pattern is a flipped Head&Shoulders pattern, i posted a pic. so that people would know there is the Inverted Head and Shoulders, characteristics are the same.

- Move AB should be the 0.786 of move XA.
- Correction wave BC should be either .382 or .886 retracement of AB leg.
- If the retracement of move BC is 0.382 of move AB, then CD is 1.618 of move BC. If move BC is .886 of move AB, then CD should extend 2.618 of move BC.
- Move CD should 1.27 or 1.618 extension of move XA. Measurements are made with Fibonacci.

- AB leg should be the 0.382 or 0.618 retracement of move XA.
- Correction wave BC should be either .382 or .886 retracement of AB leg.
- If the retracement of move BC is 0.382 of move AB, then CD is 1.618 of move BC. If move BC is .886 of move AB, then CD should extend 2.618 of move BC.
- Move CD should be 0.886 retracement of move XA. Measurements are made with Fibonacci.

- AB leg should be the 0.382 or 0.618 retracement of move XA.
- Correction wave BC should be either .382 or .886 retracement of AB leg.
- If the retracement of move BC is 0.382 of move AB, then CD is 2.24 of move BC. If move BC is .886 of move AB, then CD should extend 3.618 of move BC.
- Move CD should be 1.618 extension of move XA. Measurements are made with Fibonacci.
Cup With Handle Pattern
Technically speaking, a cup with handle is a rally to a new high, a decline of 20 -50 percent over 8 -12 weeks, a rally falling just short of the new high level, a second decline of 8 – 20 percent over 1 – 4 weeks followed by a breakout to fresh new highs on strong volume.Like most technical patterns, the cup with handle pattern is really little more than a variation of another technical pattern. In this case that pattern is the double top. The pattern begins after a well-liked stock rallies to a new high following a positive fundamental development. As the stock surges investors feel increasingly comfortable paying higher prices but there comes a point when the “story” of the stock fails to convert new believers. Slowly, the stock begins to drift lower as those seeking to lock-in profits outnumber those intrigued by the story. Although most of the fundamental news is still positive, many investors begin to question if the stock really is worth the prevailing market price and over time a substantial decline begins.
This process creates an important technical peak (top#1). As the stock nears a twenty percent decline from the recent highs (this decline could reach fifty percent in bear markets) buyers begin to reassert themselves and the stock stabilizes and a reaction low occurs. From this point forward, the bias begins to tilt gradually higher. During this phase the stock may be the subject of positive Wall Street analyst comments, a new product announcement or legal victory. As the rally gains steam sentiment improves dramatically and new buyers begin to talk about certain new highs but those that purchased the stock at or near top#1 get ready to sell. These investors may have been waiting as long at 12 weeks for an opportunity to sell their positions without incurring a loss and they are not dissuaded by all of the new found bullish talk. Just short of the old highs at top#1 aggressive selling begins on no specific news but in reality some investors that bought near top#1 have already begun to sell. The stock begins to work significantly lower on increased volume creating a second, well defined top (top#2).

This large U-shaped pattern may look like a typical double top but for the purposes of this pattern, it is called the cup. Noting key resistance at top#1 and top#2, speculators begin to initiate short positions. From a technical perspective, this is a very important part of the pattern. If the stock gains downside momentum and volume continues to increase, this could very easily become a double top but as the price works lower, volume slows, sellers seem to be losing the upper hand. At this point more positive fundamental news is released and the stock price rallies. With selling pressures satiated and the flow of fundamental news decidedly bullish volume increases dramatically and the stock works toward a fresh new high. This very small U-shaped pullback is called the handle. Speculators become frantic, they must cover short positions to cut losses but the supply of stock for sale has been significantly curtailed because investors that bought at top#1 have liquidated positions. The next session Wall Street analysts make positive comments and the stock surges to a new high on dramatically increased volume. Weeks later the stock trades at substantial new highs.
How to calculate the target after breakout?
The technical target for a cup with handle pattern is derived by adding the height of the “cup” portion of the pattern to the eventual breakout from the “handle” portion of the pattern.
Details you should know.
- Cup with handle patterns are very similar to double top patterns with the exception being that selling does accelerate after the formation of the second top, instead the stock consolidates and eventually pushes beyond overhead resistance on strong volume.
- Generally, most cup with handle patterns are completed over the course of 9 -16 weeks and involve two separate pullbacks of 20 – 50 percent (cup portion) and 8 -20 percent (handle portion).
- Upside breakout from the handle portion of the pattern should occur on strong volume. This increase in volume verifies that selling pressures have been satiated.
- Upside breakouts often lead to small 2-3% rallies followed by an immediate test of the breakout level. If the stock closes below this level (now support) for any reason the pattern becomes invalid.
Descending Broadening Wedge.
 The descending broadening wedge is a bullish reversal pattern formed by two diverging downward slants. To confirm an descending broadening wedge, there must have oscillation between the two lines. Each line must be touched at least twice for validation.
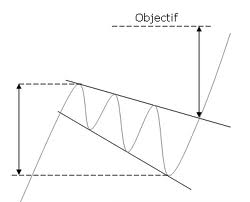
This pattern marks the shortness of sellers. This one is characterized by a progressive reduction of the amplitude of the waves. Indeed, the pattern looks like a bearish channel on which the slope of the resistance is getting straight as far as the movement continues. In this pattern, the trend is bearish but sellers are struggling to keep control.
The target price is given by the lowest point that resulted in the formation of the wedge.
Share this:

 Forex News
- US Dollar Slumps After NFPs Miss Expectations, US Equities Bid
- Euro Gains Again As Risk Appetite Holds Up Into Key US Payroll Release
- Market Update – Apple Soars, Gold Struggles, USD and VIX Slip, Sentiment Positive Ahead of NFPs
- US Dollar on Tenterhooks Ahead of US Jobs Data; Setups on GBP/USD, EUR/USD
- Crude Oil Bounces As Market Eyes Strategic Reserve Top Up, US Payrolls
- Market Update – US Dollar, Gold, Japanese Yen on the Move, Apple Earnings and NFPs Next
- US Dollar Outlook Post Fed Decision: EUR/USD & GBP/USD - Technical Analysis
- Fed Keeps Rates Steady, Grows Cautious on Inflation; Gold, USD, Yields Await Powell
- Japanese Yen Ticks Lower Again as Market Looks Past Intervention Jitters to Fed
- Euro Latest Outlook – Bearish Technical Signal Halts EUR/USD Ahead of FOMC Decision
Economic News
- An error has occurred; the feed is probably down. Try again later.

